
Q1 2019 Newsletter
Client Spotlight: Eye Care Institute
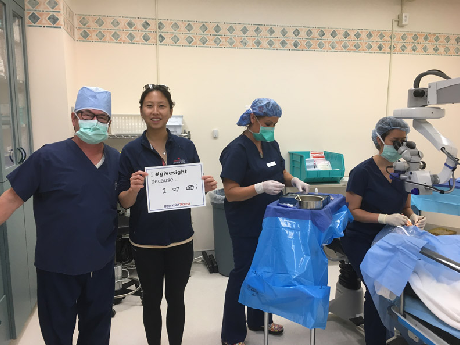

Eye Care Institute (ECI) has been serving the vision needs of patients in Sonoma County since 1952. Their Core Values (Patient First, Mastery, Kindness and Community) demonstrate their dedication to providing the best care and visual outcomes to their patients. ECI’s surgeons have also traveled internationally to provide care to patients who lack medical resources in Kenya, India, Nepal, Myanmar, Cambodia and soon in Hanoi.
ECI has participated in Operation Access, a charity event for uninsured laborers and vineyard workers for the last 5 years. During this one-day annual event, they provide 20-30 surgeries free of charge (including the costs of the surgery center, the surgeon and the anesthesiologist) to patients diagnosed with pterygium. Two years ago, their charity efforts on National Make a Difference Day were rewarded with a $10,000 “All Star Award” from USA Today/Newman’s Own to fund further services for those in need.
-
The accounting report that contains the overhead cost data is the Income Statement. Whether prepared by your outside accountant or generated from your in-house accounts payable system, the income statement is the report that provides a description of total income and expenses by category.
-
Overhead is generally defined as the percentage of income represented by overhead cost.
The questions to ask yourself regarding overhead costs include:
How should I evaluate my overhead – how should it be measured?
How can I monitor the costs over time?
How can I calculate those costs per unit of clinical work?
How can I interpret comparative (benchmark) data?
Unfortunately, many practices evaluate overhead in different ways, making it difficult to accurately benchmark against others’ performance. There are two preferred approaches:
As a percentage of revenue (overall cost and specific categories of cost)
As a cost per unit of clinical work (cost per RBRVS RVU)
This article will review both methods. First, there are some considerations required to refine your cost data.
-
You should consider your practice’s lines of businesses. First, there is the medical/surgical eye care business – the diagnosis and management of eye diseases. You may also be providing refractive surgery. This should be considered as a separate business, as should your optical dispensary, if you have one. Similarly, cosmetic surgery should be considered separately.
Remember to identify the costs and the revenue separately for each line of business. Apportion your overhead costs among the separate businesses (remember that this cost apportionment is for analysis purposes – there may be no advantage in actually separating the lines of business).
-
Traditionally, the annual cost survey conducted by the Medical Group Management Association (MGMA) was the best benchmarking data available. The survey is published for sale each summer for the previous year’s data. Over the past several years, the annual benchmarking survey conducted by the AAO has surpassed the MGMA data. The number of participating practices has allowed stratification by region of the country, sub-specialty, with and without optical dispensing, and number of physicians.
-
The first refinement in the cost data is to re-organize the categories to match the categories in the benchmarking data. The Income Statement from your accountant or your own accounting software may have general-ledger categories that do not exactly match the survey categories. For example, a benchmarking survey may have a category for non-physician employee expenses, including both salaries and payroll tax. Your income statement make show “staff wages and salary,” and a separate category for payroll taxes. For comparison, you’d add your two categories into one to match the benchmarking data’s “employee expense.” A further refinement is to assure that, in the “payroll tax” category, you exclude payroll taxes paid for the physicians.
Similarly, the survey data may have one category for “office occupancy,” while many practices have categories for “rent,” office cleaning,” “utilities,” and “office maintenance.” To get accurate comparisons, you’d need to add the four related categories into one for “office occupancy.”
Another area often requiring refinement is physician compensation. When we assess overhead cost, we generally look at both total cost, and non-physician cost. Physician cost includes physician compensation plus physicians’ payroll taxes. All physicians (partners and associates) are included in the physician data. Other physician benefits are placed in the general “Employee Benefits,” “Health Insurance,” and other appropriate categories. The main reason for excluding physician cost is that most benchmark data is based on “non-physician” cost as a percentage of income.
For calculations of cost per unit of work, total cost should be used. However, the total cost figures may require refinement to distinguish “overhead cost” from “profit.”
Profit
The success of businesses, including medical practices, is measured in profit and loss.
Traditionally, physicians who own their practice receive revenue, pay expenses, and take home the balance. The problem with this method is that the practice cannot be viewed as a business distinct from the physician-owners. The physician should wear two hats – one as a business owner and one as an employee of the practice. The physician-owner(s) should assign a “physician cost” line item. That cost should reflect the compensation (salaries/wages and payroll taxes) that would be required to replace the physician-owner(s) with employed physician(s) of comparable skills and experience.
These physician costs are added to the overhead costs, and the sum is compared to the practice income. Any surplus after the cost total is subtracted from revenue is considered profit, and any deficit is considered loss. Of course, these calculations will not necessarily affect the dollars the physician-owners take from the practice. These calculations are for performance measurement; they are not the basis for physician compensation.
These revised costs and profit and loss calculations are used to evaluate the performance (profit and loss) of the practice as well as to determine the cost-per-RVU calculations.
-
This method measures the practice’s overhead expense as a percentage of collected revenue. These percentages vary with the specialty of the practice. For instance, neurosurgeons or anesthesiologists have relatively low office expense, since most of their work is done in the hospital. A neurosurgeon’s office rent expense, as a percentage of his or her revenues, is compared to national averages for neurosurgeons. Ditto for other expense categories, such as staff salaries, office equipment, medical equipment, etc.
Focusing on ophthalmology practices, most pediatric ophthalmology practices will have a higher overhead cost than refractive surgery practices, since most refractive work is done outside the office; therefore, less office overhead expense is required.
-
Once the costs are categorized and listed, we analyze practice expenses-by category, as a percentage of revenue-by comparing each category to AAO norms.
-
Another method for evaluating cost is to examine the cost per unit of work, and the most accurate measure of practice work is to total the RVS units provided by the practice. After the RVUs are totaled, measure the total practice expenses for the same time period.
As an example, we’ll use a mythical solo general ophthalmology practice with a total of 63,958 units provided. In this example, the non-physician cost is $1,169,792. If the units are divided into the total cost, the result is $18.29 per unit.
Remember, this cost is for overhead cost (non-physician) only. Adding in a proxy for physician cost will give you a true cost of providing the service. This proxy cost should represent the salary and benefit cost to replace the physician-owners with employed physicians with the same skills.
If we use a cost of $175,000 per physician for each of the two Ophthalmologists in the practice, the total physician expense figure is $350,000, and the total expense is $1,519,792. The recalculated cost per RVU is $23.76 per unit.
Given that Medicare pays at $36 – $37 per unit, this example practice is “profitable”.
-
If you calculate your overhead and it is higher than the benchmarks, what can you do to lower that rate? There are only two things you can do – lower cost or increase income. While it is useful to examine your costs, the most effective way to lower your overhead rate is to increase income. Even if you have excess staff (the highest single component of your overhead), you can only reduce expense a finite amount. Given that much of your overhead is fixed, even relatively modest income increases will effectively lower your rate, often significantly.
-
By Paula Muhlenbruch
Medical providers and groups must complete revalidations and credentialing updates on a regular basis for the insurance carriers they participate with. This process allows the insurance carriers to stay current with the latest requirements regarding state and federal guidelines and to make sure the carrier has the most current information pertaining to the group and/or provider on file. Please note each carrier will have their own specific guidelines for how frequently this process must be completed.
It is extremely important that you do not ignore these requests for revalidation, because a lack of compliance will result in the deactivation of your billing privileges. When this happens, you will not get paid for the services you have provided, and, in most cases, you don’t get a written notice of deactivation. You will only notice it when you start to get denials from the carriers. Please note it can take from 90-120 days to reactivate billing privileges; in some cases, the carrier will not retro the reactivation date, so you will not get paid for services rendered during the deactivation period.
Meet the Biller: Lisa Biasella


Lisa Biasella joined the PRMG team in January 2009. She is celebrating her 10-year anniversary with PMRG! Lisa is a graduate of Robert Morris College, with a degree in accounting systems. Prior to joining to PMRG, she worked as an office manager/biller for a therapy center and a nursing home.
Lisa is a Senior Team Manager who oversees many of our retina and general ophthalmology accounts. In addition, Lisa is managing PMRG accounts on the Modernizing Medicine practice management system. Lisa enjoys trouble shooting system and claim issues as well as resolving difficult aged balances.
Lisa is a big baseball fan and spends many hours in the spring and summer at her teenage son Brandon’s baseball games, as well as watching her beloved Cubs. She also is “Mom” to many of her son’s friends and has the house where you can find all the kids. Lisa is an avid dog lover and enjoys spoiling her dogs, Teddy and Willie.
Lisa is the go-to resource for many of the PMRG billers. We are lucky to have Lisa on the PMRG team.