
Collection Target and Performance Analysis
We’ve looked at charge capture, at productivity and product-line analyses, and at payor mix. We’ve also looked at how our computer systems handle and report data to ensure that we’re getting an accurate picture of our clinical activity translated into financial information. In this issue of the newsletter, we’ll put all of the income data together to calculate a collection target.
Your billing and receivables cannot be managed without calculating collection targets, any more than a physician can manage a glaucoma patient without measuring intraocular pressure.
Glossary of Terms
Collection Ratio is the percent of the charges that are collected. There are generally two expressions of collection ratios: gross collection ratio and net collection ratio.
Gross Collection Ratio (GCR) is the ratio of total collections to gross (unadjusted) charges ($ collected ÷ $ charged).
Net Collection Ratio is the ratio of the actual amount collected to the amount possible to collect.
Date-of-service reporting is a method to tie payments to charges.
-
Determine if your computer system allows date-of-service reporting. When looking at the charges and collections for a particular time period, are the total charges for that time period linked with the total collections during that time period, or are the total charges and the total collections identified by the date of the report?
GCR is accurately expressed only when collections are tied to charges and when the report is generated at a time sufficiently past the charge period to allow for all collections to be made.
Determine how your system handles charges and payments. For example, a $100 to Medicare charge allows $80 for that service; Medicare pays 80% or $64. Most systems will take the $20 difference between the charge and the allowable amount as a contractual write-off, leaving a balance of $16. The $16 balance will be the responsibility either of the patient or of a secondary insurance.
The compelling question is how the system handles that $16 balance. Is it transferred to the patient or to the payor class of the secondary insurance? When the payment for the balance is paid, to what payor class is the payment posted?
If you generate a report of GCR by payor class, the report is meaningless unless you can answer these questions. Further, some systems will actually transfer the charges within the system, so even the payor-mix data are inaccurate.
We recommend always using gross charges, gross collections, and GCR to calculate a collection target.
-
Compare the practice’s fees to each payor class’s allowable payments to determine the maximum possible collections. In the previous example of the $100 Medicare charge with an $80 allowable, $80 is the maximum that can be collected. Similarly, the percentage comparison between your entire fee schedule and the Medicare fee schedule tells you what percentage of your charges to Medicare you can expect to collect.
If your fee schedule was generated using RBRVS as a conversion factor, or by a multiple of the Medicare fee schedule, the comparison is relatively straightforward. If your fee schedule is calculated at $75 per RBRVS unit, comparing that conversion factor to the year 2000 Medicare conversion factor of approximately $36 per unit, you should be able to collect 48% of your gross charges to Medicare ($36 ÷ $75).
Similarly, if you use a multiple of the Medicare fee schedule to generate your practice’s fees, the possible collections for your charges to Medicare are calculated from that multiple. An example would be a fee schedule that is two times Medicare. The maximum possible collections would be 50% of charges.
If your fee schedule was not generated from a conversion factor, calculate the average-weighted conversion factor for your fee schedule, using the methodology presented in the August/September issue of this newsletter, and compare the result of that calculation to the Medicare conversion factor.
Similarly, for managed care, the practice’s fees are analyzed and compared to the managed care allowable payments. The methodology is similar to that used for Medicare. You are comparing your fee-CF (the CF used to generate your fees or the calculated average-weighted CF) to the conversion-factor equivalent of the allowable payment levels in the managed care contracts. For example, if your fee schedule is two times Medicare, and the managed care plans in your community pay at about Medicare plus 15%, you should collect approximately 115% of Medicare (managed care allowable payments) compared to 200% of Medicare (your fee schedule). The calculation is 115 ÷ 200 = .575, or 57.5% of charges.
This procedure is repeated for each payor class and the individual targets multiplied by the percent of the practice’s charges for each payor class.
For most payor classes, the blended payor’s allowable payment levels, expressed as a conversion factor, are divided by the practice’s fee conversion factor to calculate a gross target for that class. An alternative method is to substitute the relationship of the practice’s fees to the Medicare fee schedule, compared to each payor class’s allowable payment level, compared to the Medicare fee schedule (see the managed care example above).
For the self-pay and indemnity classes, these calculations do not apply.
If self-pay is composed of patients who are uninsured, the collection percentage is usually 20% to 30%. Of course, if patient balances are transferred to this class after a managed care payor or Medicare has already paid, you will have payments for which there are no charges (at least in this class). While the target of 20% to 30% remains valid, the actual GCR may be well over 100%.
Similarly, using the same example, the Medicare class will have the same calculated target, but if patient co-payments are posted to the self-pay class, and Medi-Gap insurance payments are posted to another insurance class (e.g., indemnity, Blue Shield, or managed care), the payments generated by Medicare charges will be understated.
The indemnity class is composed of those insurance plans where the patient is responsible for any balance after insurance has paid. In principle, the collection opportunity is 100%; realistically, collecting 90% to 95% is all that can be expected. This is a fee-for-service collection target. For practices with capitated patients, the data can be handled in two ways. One method is to include the capitated charges but also to record a collection expectation of 0%. The second method is to exclude the capitated charges from the analysis.
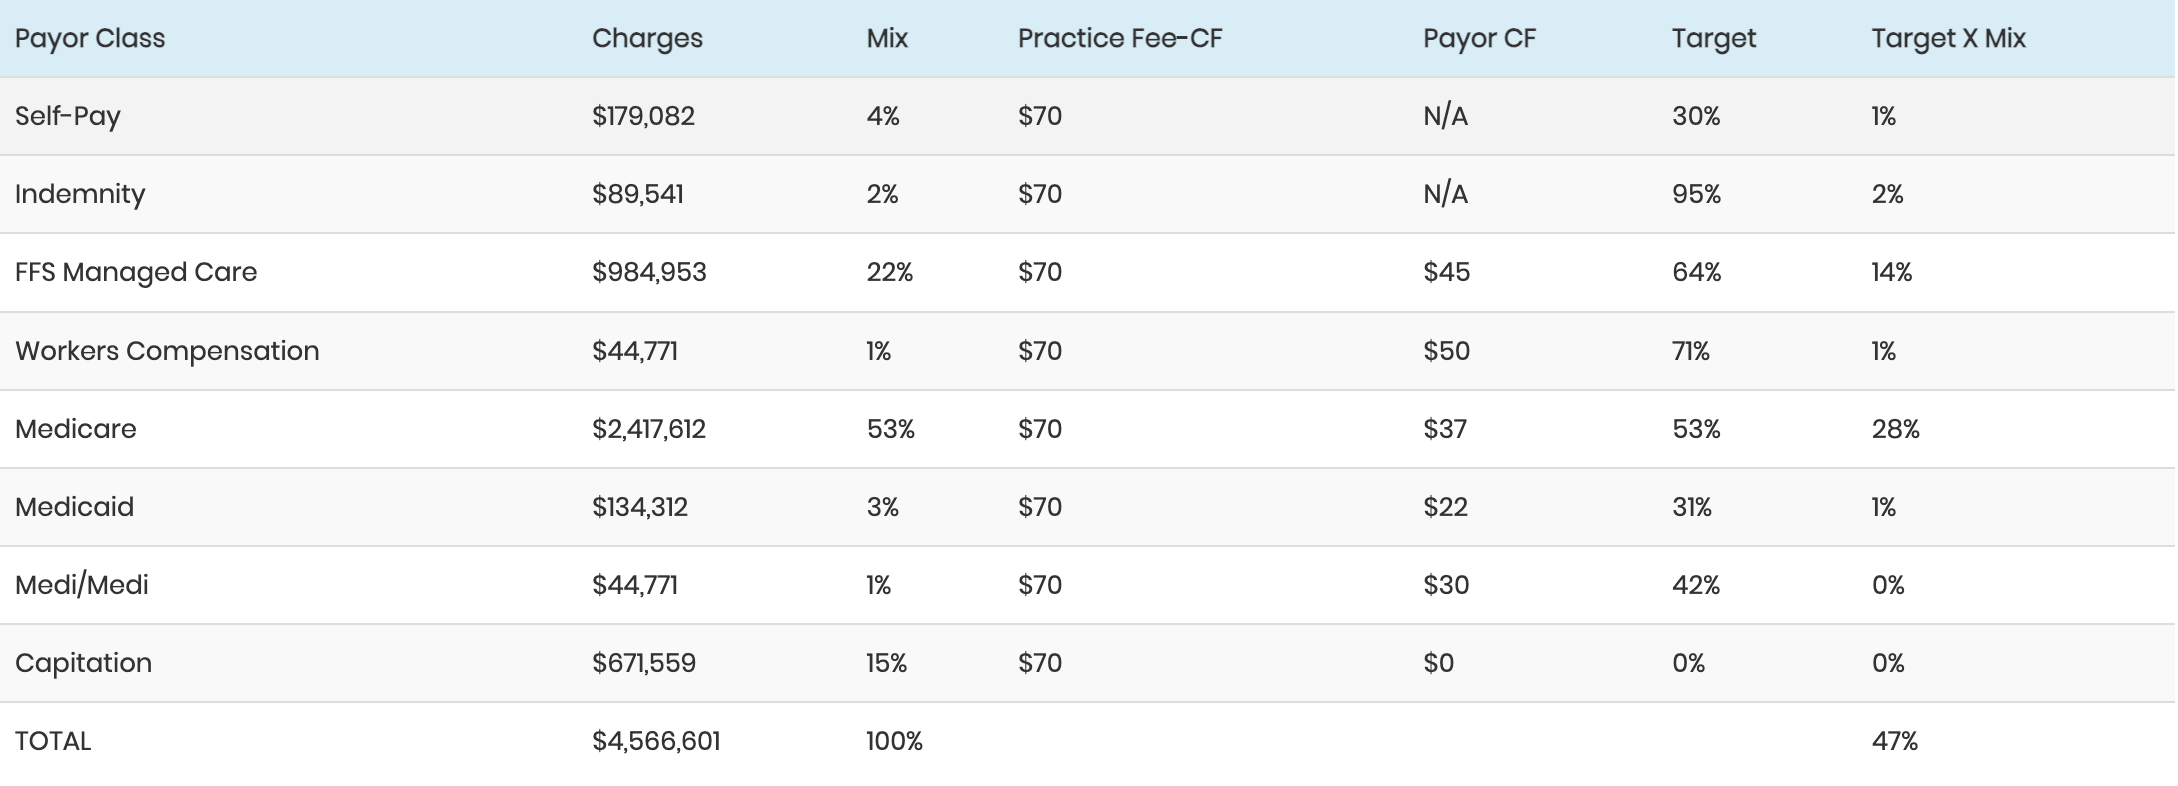
Fee-for-Service Collection Target Calculation
The following is an example of a fee-for-service collection target calculation, with capitated charges included:
The same set of data with capitated charges excluded would be as follows:

The overall target is higher in this second analysis because the charges are lower and because the excluded charges had the expectation of $0 payments.
The targets will be adjusted if the practice provides many surgical cases with multiple procedures and/or cases where the surgeon acts as an assistant. In the case of multiple procedures, the expected payment is reduced by either 50% or 75%; and for surgical assists, the reduction is from 67% to 84%.
An analysis of the practice’s production report with the modifiers that indicate multiple procedures (51) or assists (80, 81, 82) should be done to determine an adjustment factor for the surgical charges and then the overall charges.
Here is a review of the practice’s actual collection performance:

As seen here, the actual performance is within 4% of the target. Given reductions in collections from bad debt write-off, professional courtesy, surgical assists, and multiple procedures, this 4% spread is well within an acceptable range.
There are several factors that will impact the accuracy of the report.
First, the methodology may have to be adjusted to match the conditions of your practice. For example, you may have a physician just starting out in practice, and to supplement the Ophthalmology portion of the practice, he or she does some surgical assisting. This can impact the target, especially if the assists are charged at the full surgical fee. The expected payments will be significantly reduced in this case. Similarly, if you are in a subspecialty that commonly provides surgical services with multiple procedures appropriately coded, the expected payments will be sharply reduced.
Another factor to consider is the reporting and timing of the charge and collection data. It is best to use a three-month moving total of charges, with the collections on those charges used to determine the GCR. To accomplish this, you’ll need to wait at least 90 days after the last charge to get an accurate sense of the GCR. This means, for example, that if you have closed the books for October, you’ll be looking at charges for May, June, and July and at the total collected on those charges as of the end of October.
Finally, it is important to focus the collection-target calculation on one line of business. That is, the collection percentages and methodologies are different enough for Refractive Surgery and Optical Dispensing that those businesses should be tracked separately from your med/surg business; and the collection targets for each line of business should be calculated separately, including services provided from the separate lines of business to the same patient.
These calculations are not accurate to the nearest percentage point. Bad debt, payor-class assignment errors, timing of charges and payments, and several other factors combine to make these calculations somewhat inexact. If the actual collections are within 5% of the target, we consider the collections acceptable.
Ron Rosenberg, PA, MPH, Author Practice Management Resource Group San Rafael, California
Irene Chriss, Editor Director, AAO Practice Management Department