
Q2 2018 Newsletter
This is the first issue of the PMRG quarterly newsletter. In this issue, we will discuss financial performance at an overview level. In future editions of the newsletter we will take a deeper dive into some of the topics (accounts receivable, practice development, practice overhead, etc.).
What is required to manage something? To manage is to set goals or targets for your performance, assess the actual condition/results of your performance, and to intervene in any areas that fall short of your targets. In this issue, we’ll discuss the managing of practice financial performance.
To optimize financial performance, what is there to manage?
Productivity – The volume and mix of services provided by the practice.
Business process performance – The level of income your business/billing office/outsourced billing service is generating compared to the collection value of those services (given your insurance contracts).
Profitability – The revenue remaining for distribution to practice owners after all financial obligations are covered
What data are required to measure performance? Reports! Which reports are required, and where do you get them? The first questions include:
How to get the data (understanding how your practice management software is configured and how the data are reported
How to display the data
How to interpret the data
How to design actions based on that interpretation
Reports should give the practice’s status in a condensed review. It should take no more than 15 minutes per month to review and should include vivid displays (e.g. charts, graphs, etc. that quickly and clearly communicate numeric values).
Reports will provide information to the practice’s owners so that they can:
Prepare for and support strategic decisions
Monitor operations and performance
Identify problems in the business process
Guide practice operations
So how do you design the reports you want?
Begin by defining the questions for which you need answers. For example, “What are the charges, receipt, and volume of services for the practice, by month?”
Some examples, taken from the PMRG Monthly Reports provided to clients, include:
An overview of charges, payments, and adjustments. Note the 12 months of longitudinal data:
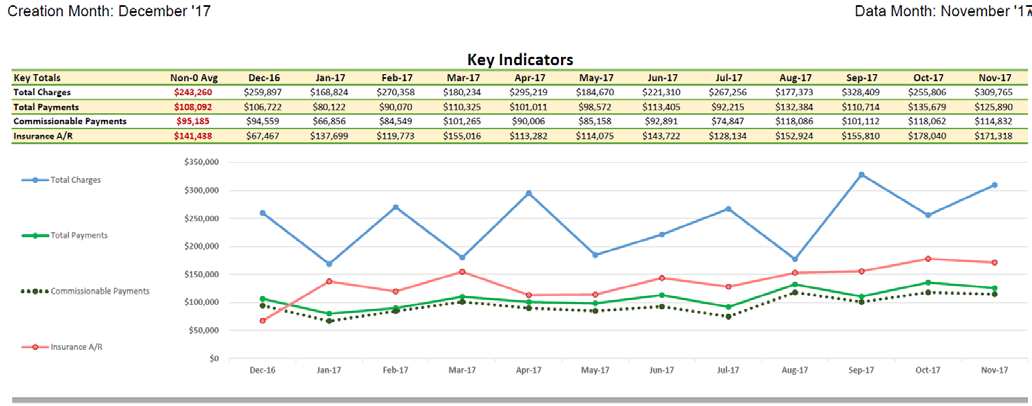
Notice the irregular line (blue) for total charges. This pattern is not uncommon for a one- or two-physician practice. Any time spent out of the office for the physician(s) will have a magnified effect of the charge graph.
Next, notice that the payments line (green) roughly follows the charge-volumes, generally trailing by one or two months. This metric is not as sensitive to absences from the practice because the payments will continue to be received and posted even in a physician’s absence; consequently, these lines are smoother.
The Total Payments and Commissionable Payments lines represent the difference between all payments and those subject to PMRG commissions. For each client, certain payments are excluded from commission. Generally, those include optical sales, injectable drug costs, cosmetic procedures, and miscellaneous product sales.
Accounts Receivable
Accounts Receivable (A/R) represents unresolved charges. When a charge is entered, the A/R increases by the amount of the charge. When a payment or adjustment is posted, the A/R decreases. When a charge is completely resolved, the A/R balance for that charge is $0.
The A/R totals are in “buckets” representing the length of time (or “age”) that the charge has been outstanding. AdvancedMD standard reporting has five A/R buckets: Current (0-30 days), 31-60, 61-90, 91-120, and 121 plus days.
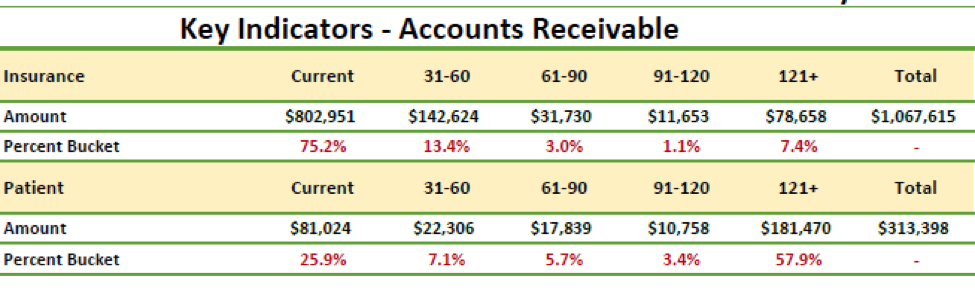
Insurance AR – The ideal pattern of insurance A/R has greater than 70% of the total in the Current (0-30 days) bucket. There should be a sharp drop in the 31-60-day bucket, and further continued decreases over the succeeding buckets, with a small aggregation of balances in the 121+ bucket. The pattern noted above shows an acceptable balance pattern. It is unhealthy when the balances “march across the buckets”. That is, when there is not a decrease in the totals from 31-60, 61-90, etc.
Another important metric is the total percentage of the A/R over 90 days. It should be less than 15% of the total. In the example above, the aggregated percentage over 90 days is 8.4%, well-below the target of 15%.
The A/R balances can be skewed by any built-in delays in payment. Two common examples include an IPA that holds all Ophthalmology charges for 90 days before adjudication. This will skew the A/R. Another example is an insurance carrier that is consistently slow to pay. The Veterans Administration falls into this category, as do certain state-funded insurance programs.
Key Indicators
This example AR table also shows a problem with patient receivables (over $192,000 over 121 days). The key to effectively managing patient balances is to maximize the collections of co-payments, deductibles, and old balances at time-of-service, thereby avoiding patient balances).
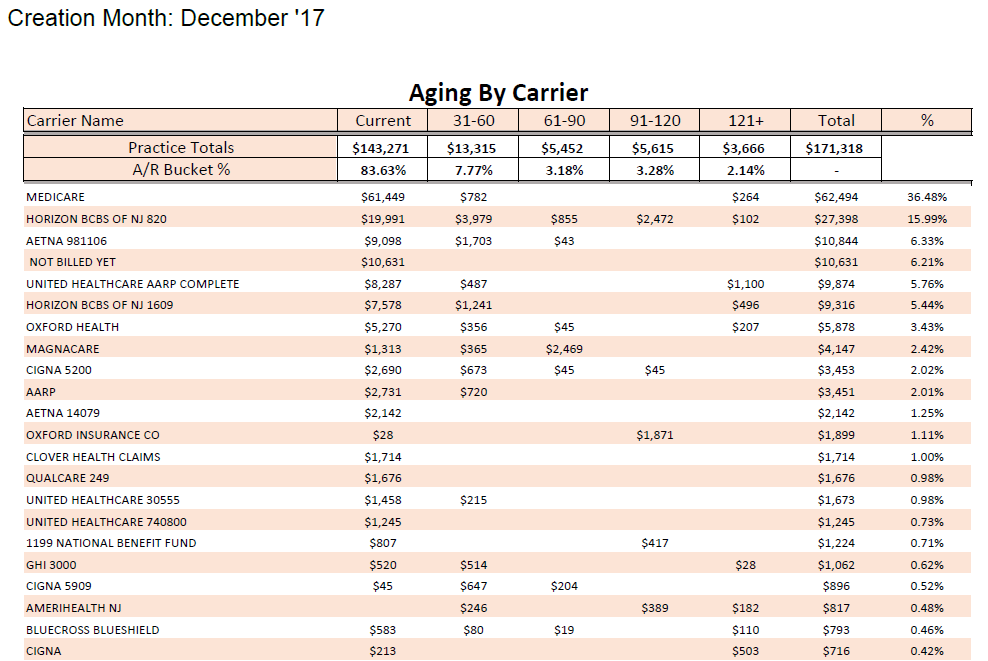
If your insurance A/R summary shows an unhealthy pattern, look at the Aging by Carrier report to see if there are one or more carriers that are outliers compared to other carriers.
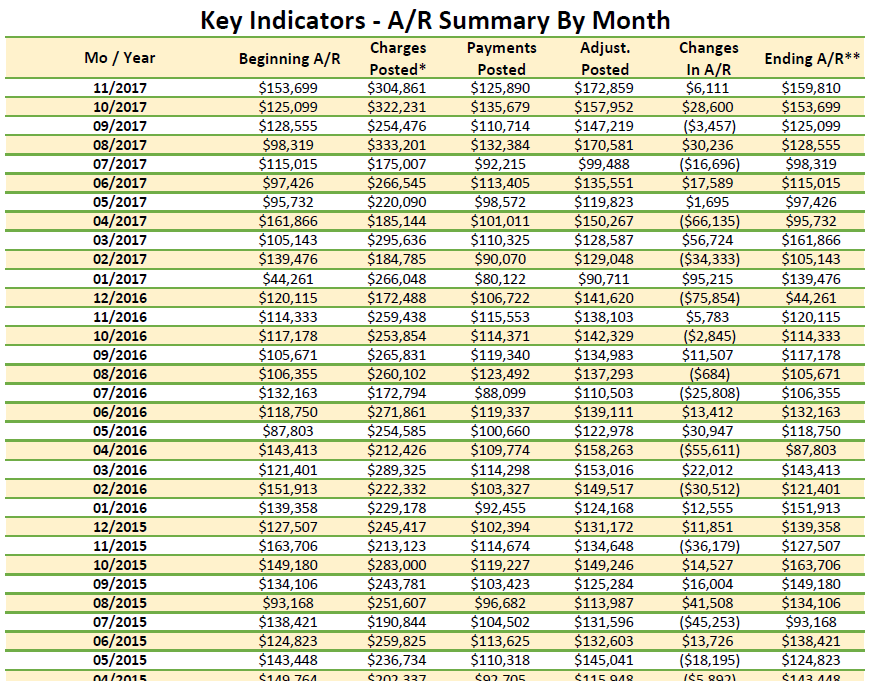
AR Summary by Month (Management Summary)
This is a useful tool for monitoring the monthly history of financial transactions and can be used to help explain changes in payments. This table provides a different look than the preceding graphs. This is the first place that we look when there has been a noticeable decrease in payments. There is generally a corresponding decrease in charges.
This tabular format will not generally be available from your practice management software. Virtually all systems, however, will provide those data for one month at a time. You’ll need to build the table by adding each month’s data to the spreadsheet.
Practice Expenses – Overhead expenses are assessed using the Statement of Profit and Loss (P&L or income statement). This is an accounting statement that shows income and expenses. Expenses are parsed out into categories. The overall percentage of income, as well as the percentage of income for some of the major categories (non-provider staff cost, office occupancy, etc.).
The most valid benchmarking data for Ophthalmology are produced by the AAO’s benchmarking survey. The “N” is large enough to compare your practice to others of similar size, sub-specialty, and area of the country. We highly recommend participation in this survey.